One Tailed v. Two Tailed
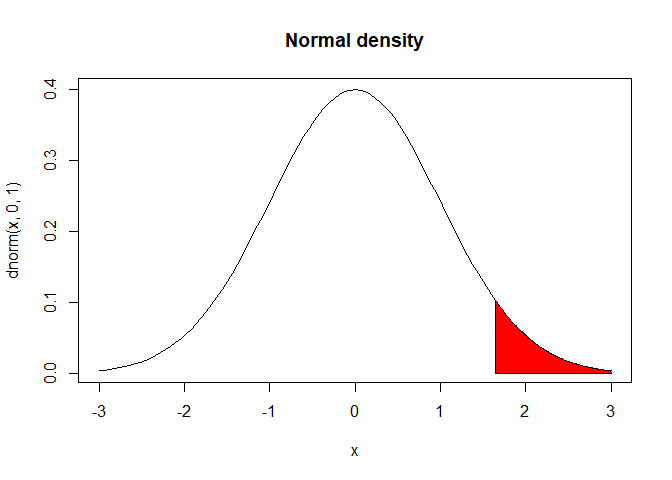
In my last post, I talked about When making a hypothesis, you might make it directional e.g. more attention will be paid after drinking coffee, or you might make it non-directional e.g. attention paid will differ after drinking coffee. For the first hypothesis you would do a one-tailed t-test because it has a direction to the positive. This gives your test more statistical power in detecting if there is a difference between the two conditions. This would only test the right side of the t distribution.
# draw the normal curve
curve(dnorm(x,0,1), xlim=c(-3,3), main="Normal density")

# define shaded region
to.z = 3
from.z = qnorm(.95)

S.x  = c(from.z, seq(from.z, to.z, 0.01), to.z)
S.y  = c(0, dnorm(seq(from.z, to.z, 0.01)), 0)
polygon(S.x,S.y, col="red")
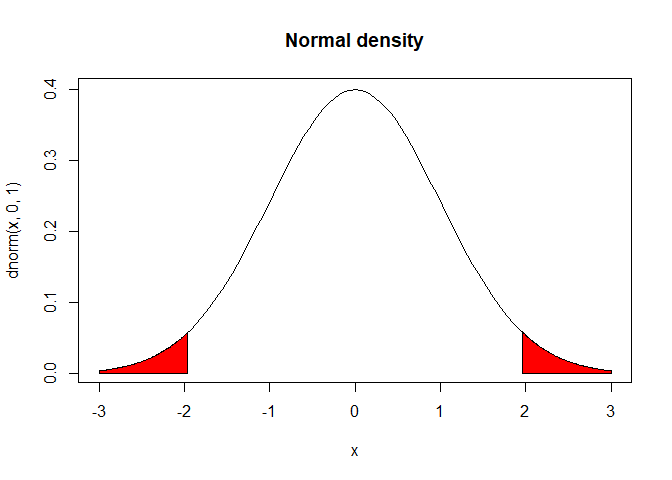
For the second hypothesis you would use a two-tailed t-test because the hypothesis has no direction. This would test both sides of the t distribution.
# draw the normal curve
curve(dnorm(x,0,1), xlim=c(-3,3), main="Normal density")

# define shaded region
from.z1 = -3
to.z1 = qnorm(.025)

a.x  = c(from.z1, seq(from.z1, to.z1, 0.01), to.z1)
a.y  = c(0, dnorm(seq(from.z1, to.z1, 0.01)), 0)
polygon(a.x,a.y, col="red")

#define shaded region
to.z2 = 3
from.z2 = qnorm(.975)

b.x  = c(from.z2, seq(from.z2, to.z2, 0.01), to.z2)
b.y  = c(0, dnorm(seq(from.z2, to.z2, 0.01)), 0)
polygon(b.x,b.y, col="red")
Independent Samples t-test (Student test)
When you have two different groups that you want to compare, like petal lengths between two plant species, you can use independent samples t-test to test statistical differences between the two groups. This tests if the two means are different. It does this by testing the null hypothesis (H0) - are the means are the same? We’re not testing the alternative hypothesis (H1) - are the two samples are different? By only testing H0 we cannot conclude anything about H1. What does this practically mean in science? Not much in terms of publication but there are several issues that I have with this approach that I won’t get into. Regardless of the issues, testing the null hypothesis has lead to many fruitful discoveries in science and it is worth studying frequentest methodology.
The student t-test can be represented as:
$$t = \frac {\overline{X_1} - \overline{X_2}} {\hat{\sigma}\sqrt{\frac {1}{N_1}+\frac {1}{N_2}}}$$
Which simplifies to:
$$t = \frac {\overline{X_1} - \overline{X_2}} {SE(\overline{X_1} - \overline{X_2})}$$
The mean of group1 minus the mean of group2 divided by the standard error of the mean of group1 minus the mean of group2.
Let’s try this in R:
#install.packages("dplyr)
library(dplyr)
data(iris)
#remove one group so there are only 2 groups - a t.test can only handle 2 groups
iris = iris %>%
  filter(Species == c("virginica", "setosa"))
t.test(iris$Sepal.Length~iris$Species, paired = FALSE, alternative ="less", var.equal = T)
##
##  Two Sample t-test
##
## data:  iris$Sepal.Length by iris$Species
## t = -11.128, df = 48, p-value = 3.415e-15
## alternative hypothesis: true difference in means is less than 0
## 95 percent confidence interval:
##       -Inf -1.287503
## sample estimates:
##    mean in group setosa mean in group virginica
##                   4.988                   6.504
There are a few things to note about the t.test command. The first input is the variable we’re comparing between the two groups. The second input is the variable containing the groups of each observation. Don’t worry about the syntax of this. I set paired = FALSE because this is a two-sample t-test. Alternative is set to less, a one-tail t-test, with the hypothesis that setosa will have shorter sepal length than virginica. Thus I tested only the left side of the tail and not the right side. Var.equal is set to TRUE because I’m assuming (and know) the variance between the two groups is not significantly different.
A thing to note is whether the t statistic is postie or negative, it doesn’t exactly matter. In this case, setosa is group1 and virginica is group2. Since it’s comparing means it’s solely dependent on which group you label as group1 and which one.
To do a two tailed test in R:
t.test(iris$Sepal.Length~iris$Species, paired = FALSE, alternative ="two.sided", var.equal = T)
##
##  Two Sample t-test
##
## data:  iris$Sepal.Length by iris$Species
## t = -11.128, df = 48, p-value = 6.83e-15
## alternative hypothesis: true difference in means is not equal to 0
## 95 percent confidence interval:
##  -1.789919 -1.242081
## sample estimates:
##    mean in group setosa mean in group virginica
##                   4.988                   6.504
This would be done if we don’t have a directional hypothesis, there is a difference between sepal lengths between the two species.
Paired-Samples t-test
The paired-samples t-test is only useful when doing a repeated measures design - each participant is in both experimental conditions. These types of experiments have more statistical power. An example would be if we’re interested in seeing if someone pays more attention after drinking coffee or before drinking coffee. We Could have the same participant participate in a counter-balanced task in both conditions to test this.
I skipped over one-sample t-tests because I’ve never seen them used in practice. The reason they are taught is because a paired-samples t-test is actually a one-sample t-test that tests the within-subject difference, aka the difference from one condition to another.
A one-sample t-test looks like $t = \frac {\overline{X} - u} {\hat{\sigma}\sqrt{N}}$, while the paired-samples t-test looks like $t = \frac {\overline{X_1} - \overline{X_2}} {SE(\overline{X_1} - \overline{X_2})}$.
In R:
t.test(iris$Sepal.Length~iris$Species, paired = TRUE, alternative ="less", var.equal = T)
##
##  Paired t-test
##
## data:  iris$Sepal.Length by iris$Species
## t = -10.687, df = 24, p-value = 6.61e-11
## alternative hypothesis: true difference in means is less than 0
## 95 percent confidence interval:
##       -Inf -1.273304
## sample estimates:
## mean of the differences
##                  -1.516
This is only for demonstration purposes. Obviously, there are two groups and this would be an inappropriate test that I just did. It would be correct to do if took the setosa group and measured sepal length when sunlight was present versus when sunlight isn’t, then we could use a paired-sampled t-test.
The t-test has three assumptions:
Both groups are normally distributed.
The two groups were independently sampled. This means there isn’t one observation in both groups. Or more practically, there are no siblings in your dataset.
The standard deviation between the two groups is the same. In practice, this is almost never true for your data.
In the next post, I’ll discuss ANOVAs.