In my past post, I talked a lot about the normal distribution and how to check if your data has normality. One of the reasons we rely on a normal distribution is because of the null distribution, the sampling distribution under the null hypothesis. Basically, how many observations you have, the size of your n, determines how your null distribution looks. In the next post I’ll talk more how this relates to significance testing.
The Null Hypothesis
The null hypothesis, H0 as it’s often referred as, can often be viewed as that there is no difference between two groups. For example if we have two groups, G1 and G2, and we think G1 is taller than G2, the H0 is, $G1 height = G2 height$. If we add a third group, G3, H0 becomes $G1 height = G2 height = G3 height$. When the = sign is used here, it doesn’t mean literally equal to each other, it mean statistically equal to each other and we use the null distribution to help determine this.
The Alternative Hypothesis
The alternative hypothesis, H1 as it’s often referred as, can often be viewed as that there is a difference between two groups. Using the last example, H1 would be $G1 height \neq G2height$.
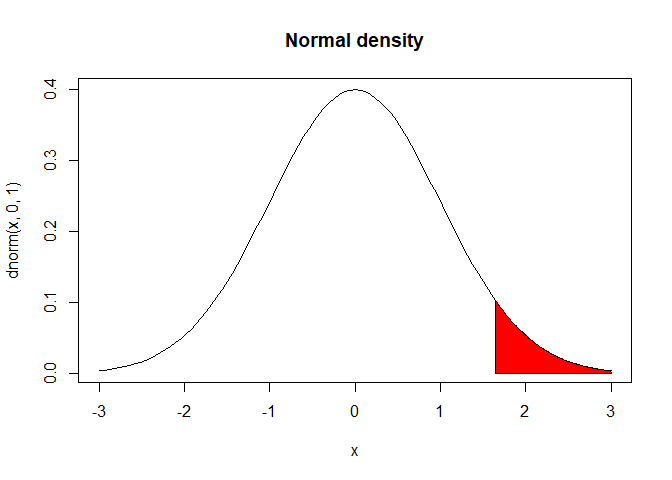
##Hypothesis Testing One-sided testing is when you only test one side for the null distribution.
# draw the normal curve
curve(dnorm(x,0,1), xlim=c(-3,3), main="Normal density")

# define shaded region
to.z = 3
from.z = qnorm(.95)

S.x  = c(from.z, seq(from.z, to.z, 0.01), to.z)
S.y  = c(0, dnorm(seq(from.z, to.z, 0.01)), 0)
polygon(S.x,S.y, col="red")
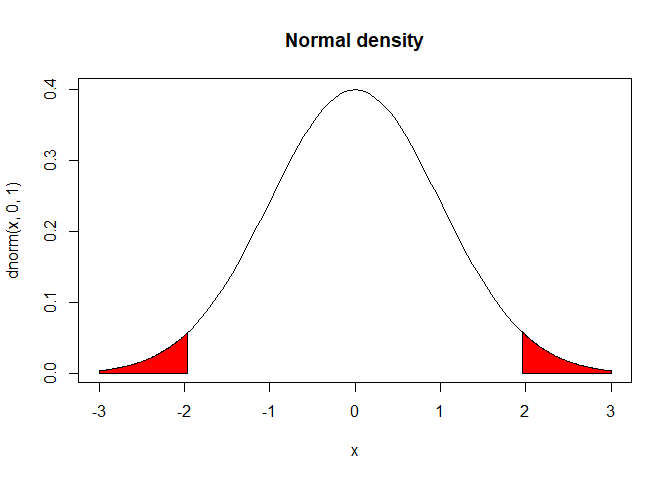
Two-sided testing is when you test both sides of the null distribution. This is when you have a non-directional hypothesis. For example, what if you don’t have any idea if G1 or G2 is taller but you do have an inkling that there is a difference between the two groups. This is when you’ll use a two-sided test.
# draw the normal curve
curve(dnorm(x,0,1), xlim=c(-3,3), main="Normal density")

# define shaded region
from.z1 = -3
to.z1 = qnorm(.025)

a.x  = c(from.z1, seq(from.z1, to.z1, 0.01), to.z1)
a.y  = c(0, dnorm(seq(from.z1, to.z1, 0.01)), 0)
polygon(a.x,a.y, col="red")

#define shaded region
to.z2 = 3
from.z2 = qnorm(.975)

b.x  = c(from.z2, seq(from.z2, to.z2, 0.01), to.z2)
b.y  = c(0, dnorm(seq(from.z2, to.z2, 0.01)), 0)
polygon(b.x,b.y, col="red")
Errors
Type I Error is when you have a false positive, when you find a significant difference ($G1 height \neq G2height$) when the truth is $G1 height = G2height$.
Type II Error is when you have a false negative, when don’t find a significant difference ($G1 height \neq G2height$) when the truth is $G1 height = G2height$.
| H0 True | H0 False | |
|---|---|---|
| Reject H0 | Type I Error | Correct |
| Accept H0 | Correct | Type II Error |
In the next post I’ll talk about how to test for statistical differences between two groups